Case Study 2: IRIS for Health
What to disclose?
InterSystems
Background
I am helping an integration engineer connect the different systems in a hospital and investigate connection failures. A physician may request an x-ray on their system, and that request needs to be received by the x-ray department. When the x-ray department performs that x-ray, those images need to be sent back to the physician. There are thousands of messages being sent in a hospital every day–from a nurse requesting a meal service for an inpatient to the billing department processing insurance for patient discharge. This is interoperability: and when it breaks, patient care suffers.
This case study is part of a larger project. Click here for an introduction.

Setting the Scene
Jennifer has connected the x-ray department to the physician's office. She routes the data through a "logic endpoint". This endpoint determines which physician office the data will send to. For example "if the data contains the tag "Dr. Morris", it will be sent to Dr. Morris's office. Furthermore, the logic will also transform the data. The x-ray department records their patient IDs with a prefix 1-12345. However, Dr. Morris's office records the IDs as 12345, so that prefix needs to be removed.

Problem
Since Jennifer will need to edit a transformation, she wants to be aware of any downstream impact. She'll need to cross-reference multiple resources to understand and visualize this information.
Jennifer keeps a spreadsheet that shows which DTL sends to which final destination end point. She'll reference it every time she wants to make a change and see all the downstream areas it may impact.
She'll also use the routing lines that are visually present when selecting an end point to understand how the systems are connected. Sometimes these end points are located far apart on the diagram. Jennifer needs to scroll up and down and can’t see all the connections within one screen.

Why This Matters
When users can’t easily visualize how systems are connected, they may negatively affect a system with any edits earlier in the data piepline.
When Jennifer was looking for the transformation routed to Dr. Morris, she had to search through a table to see where it was used. If she wanted to visualize the information in this table, she has to cross reference the connections diagram with the table.
GRAPHIC HERE WITH THE TABLE AND VISUALIZATION SIDE BY SIDE
Solution
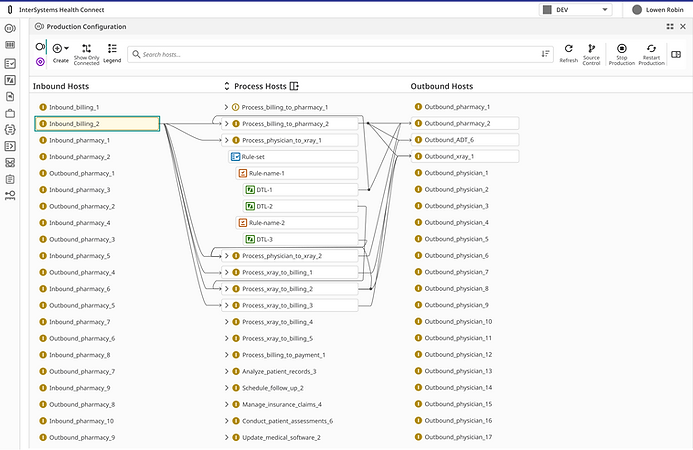
As discussed in Case 1, the routing logic can now visually expand to show the rules and transformations. Now that we have that information available, we can also show it in the connections diagram. Jennifer no longer needs to cross reference a table - she has all the information she needs in a single visual.

Another thing we can do now that we have access to the rules and transformations in the connections diagram: we can search it! This filters the view to only show items that contain that transformation, and you can still see where it's connected.

And finally, if information is spread far enough apart that Jennifer needs to scroll often, she can toggle her view to hide any end points that aren't part of the connection.

Before Toggle

After Toggle
Impact
-
Mitigated risk by increasing clarity of data dependencies
-
Reduced time required to assess downstream integration impact by consolidating information into a single visual workspace
Users reported during testing:
"That's great that I can no isolate my view to exactly what I want to look at."
"I love the search feature. We've been wanting something like this for a long time."